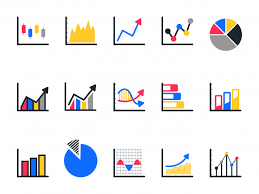
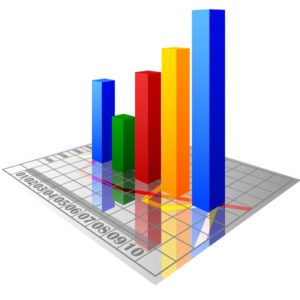
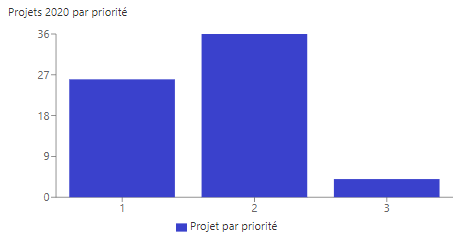
Graph

Global View

A graph is a pictorial representation or a diagrammatical illustration of a set of data or values in an organized manner. The points on the graph often represent the relationship between two or more things.

About our Graph

MEDIA AP has been at the forefront of Sharepoint solutions since 2015. Our SP Reporting application helps customers of all sizes to immerse themselves in Sharepoint data and get a clear picture of their business. Sharepoint is a popular and widely used tool, but without the right reporting software, companies have to collect their data from different departments and combine them manually, or purchase expensive analysis software. This is time consuming and also subject to human error.
SP Reporting is a flexible and easy to use tool to report and track your SharePoint data.
The SP reporting application provides an easy way to access and display multiple graphs on a SharePoint page. These graphs can be generated by any user.

The purpose of the graph is to present the data in the list in the form of visual elements. These elements provide an overview of the main measurement and performance indicators of your department or organization.

Bar Chart

A Bar Chart is a graphical display of data using bars of different heights.

Line Chart

A line chart is a graphical representation that connects a series of data points with a continuous line

Scatter Chart

A Scatter (XY) Plot has points that show the relationship between two sets of data.
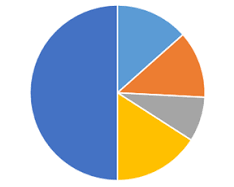
Daughtnut Chart

a special chart that uses "pie slices" to show relative sizes of data.

Radar Chart

A Radar Chart is a way of comparing multiple quantitative variables on a polar grid.

Staked Chart

In a stacked column chart, data series are stacked one on top of the other in vertical columns.

Double Bar Chart

A double Bar Chart is a graphical display of two data using bars of different heights.

Double Line Chart

Double line graphs are two line graphs that are graphed on the same coordinate grid for the purpose of comparison

Some Comparison

Staked VS Double Bar

Staked VS Double Bar

l
l
l
l
l
l
l
l
l
l
l
l
l
l
l
l

Line VS Double Line

Line VS Double Line

Line VS Double Line

All this has a single purpose, to make it easier for users to navigate and to make the platform simpler and easier to use.
For more information on the Graph product or another product, please do not hesitate to contact us.

Exemples

en_USEnglish